Explore MS Data with Spectral Group Review Mode
What's New in 2024R3
The Spectral Group Review mode significantly enhances your ability to analyze mass spectrometry data, particularly for complex samples and specific compound identification. This guide highlights its key functionalities with examples.
Note
The Spectral Group Review feature requires either HRMS editions or the Advanced MS addon enabled.
Example 1: Exploring the Full Spectral Range
This capability provides a comprehensive view of your sample's entire MS data, serving as a critical first step in many analytical workflows. For example, in a routine quality control analysis, using the full spectral range can quickly reveal unanticipated contaminants or background artifacts.
Quick Checking with MS Cube
Tip
The MS Cube feature is available in all editions.
- Open an image with MS data.
- View > MS Cube.
- Adjust View Controls > Visibility > Threshold.
- Visually check the distribution of significant ion fragments in the Cube View.
-
Drag Slicer for a quick check of selected ion chromatograms (SIC).
Detailed Examining with Spectral Group Review
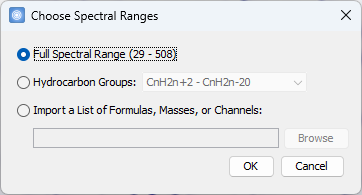
- Review > Spectral Group Review.
-
Choose the Full Spectral Range option, and OK.
-
Select any row in the table to examine the SIC in detail.
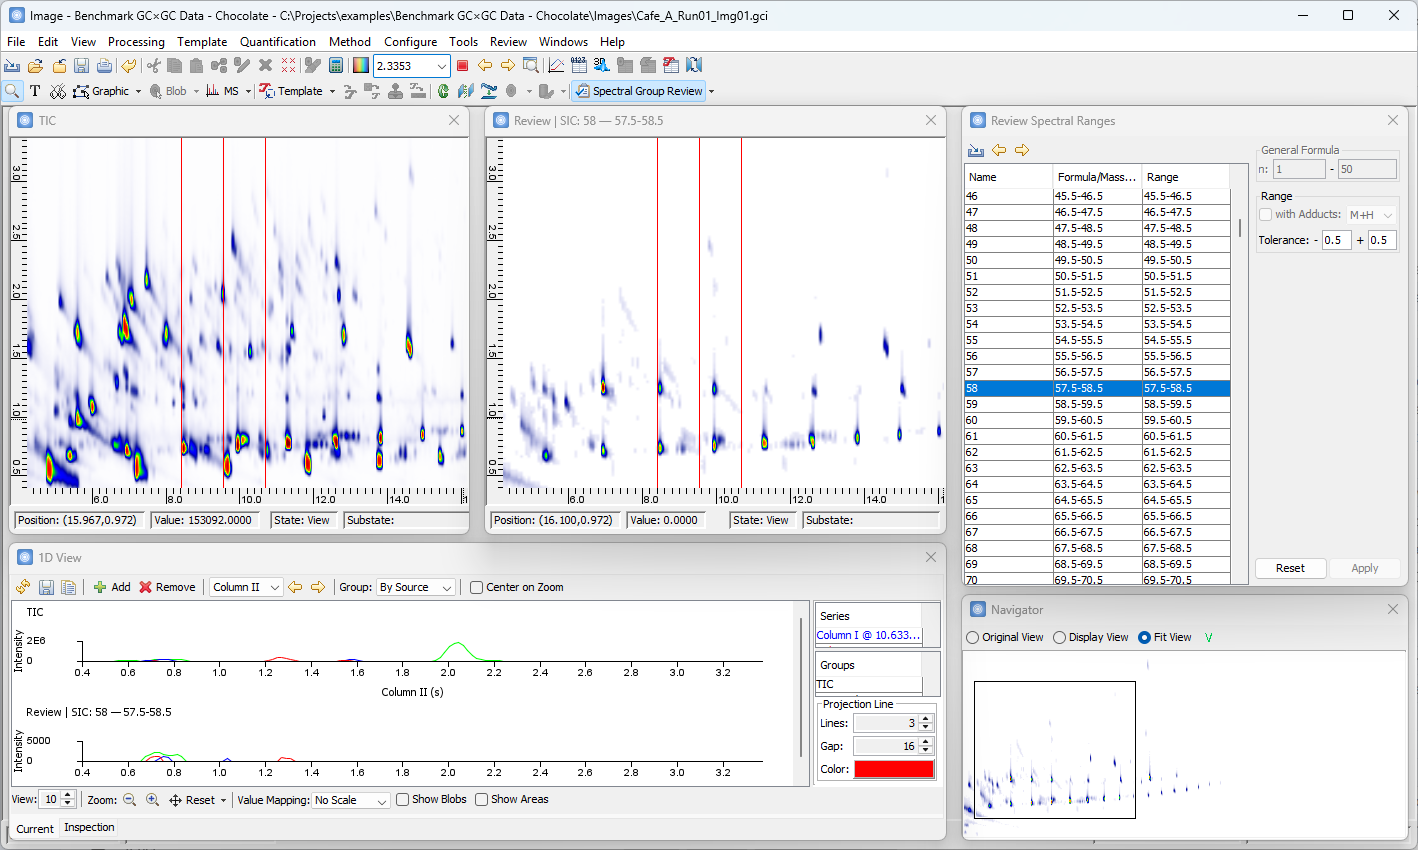
Note that all tools and navigation operations can be used in the Review mode.
Example 2: Customized Hydrocarbon Groups
The Spectral Group Review mode includes built-in options for common hydrocarbon groups such as CnH2n+x and ASTM D2786 mass groupings for review.
In addition, it supports customization that allows you to define the exact m/z ranges for your specific analytical needs, going beyond standard definitions. For example, for a crude oil sample, you can define custom spectral ranges to specifically isolate and quantify different classes of aromatics (e.g., monocyclic, polycyclic) or branched vs. linear alkanes based on their characteristic fragment ions, providing a detailed compositional fingerprint for source identification or quality assessment.
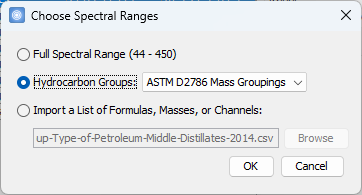
- Review > Spectral Group Review.
-
Choose the Hydrocarbon Groups - ASTM D2786 Mass Groupings option, and OK.
-
Select any row in the table to examine the SIC in detail.
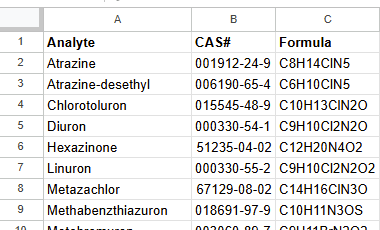
- Click on the Import button, and choose the Import a List... option.
-
Browse to choose a CSV or Excel file.
As an example, you can download Table 2 extracted from the following publication:
-
Choose the Name and Mass columns to import.
-
Select any row in the table to examine the SIC in detail.
Note that, while hydrocarbon groups tend to localize within characteristic regions on the SIC, intergroup overlap is present, suggesting that separation is not entirely discrete.
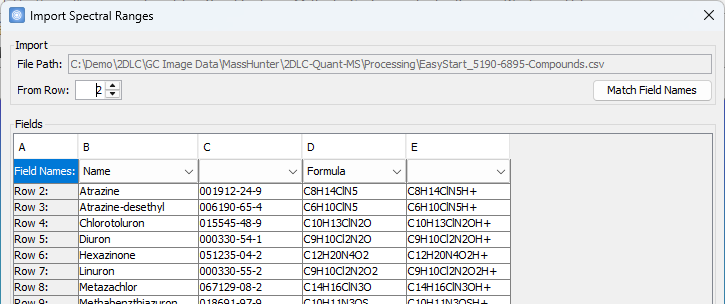
Example 3: Targeted Compound Identification for 2D-LC-MS
Leveraging the import option, this mode becomes highly powerful for highly specific targeted compound identification. For example, you can create a CSV file with the precise m/z values and adducts of specific compounds and import it into the Spectral Group Review mode. This allows for rapid visualization and identification of each targeted compound across the complex 2D-LC-MS data with high specificity.
-
Create a table of chemical formulas of targeted compounds.
-
Review > Spectral Group Review.
- Choose the Import a List... option, and browse to choose the table file.
-
Choose the Name and Formula columns to import.
-
Configure Adducts and Tolerance options, and apply.
-
Select any row in the table to examine the SIC in detail.
Note that most compounds can be uniquely identified on the SIC based on their exact molecular weight and specific adduct ion.