Overview - Software Capabilities
Broad Support for Data Formats
The software imports many popular chromatographic, mass spectral, and UV file formats, including proprietary formats from Agilent, Shimadzu, JEOL, VUV Analytics, Thermo, Sciex, Waters, and other vendors, and standard formats such as CSV, CDF, mzData, and mzXML.
Multifaceted Visualization & Data Review
The software offers a variety of interactive visualizations including 1D graphs, 2D chromatogram views, 3D views, and tabular views. The Review Mode allows rapid inspection of analytical results. Customizable modes allow for user defined window layouts and review-focused interaction between the views.
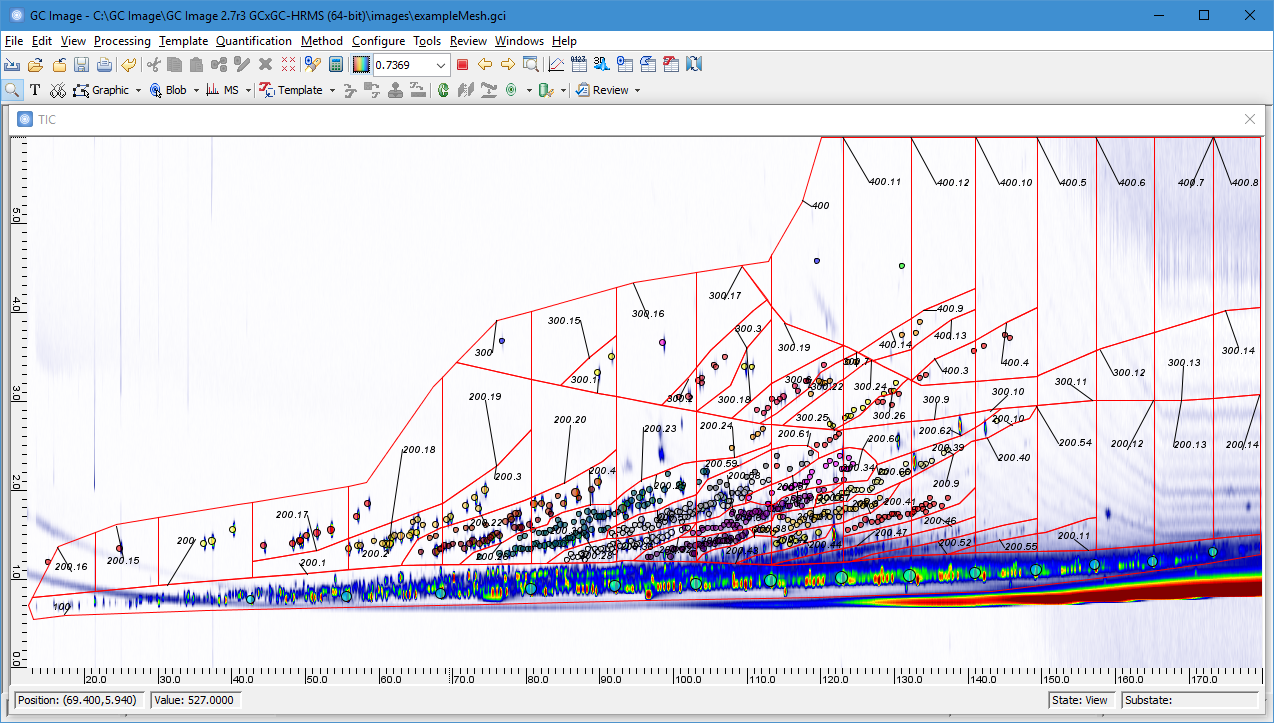
Comprehensive Group Analysis
The software provides sophisticated graphical objects that can be used to define 2D retention-time windows for manual integration or group analysis. Mesh objects can also be created to easily define comprehensive groups of peaks or chromatographic regions. These tools are suitable for the ASTM D8396, UOP-990, and UOP-965 standard methods.
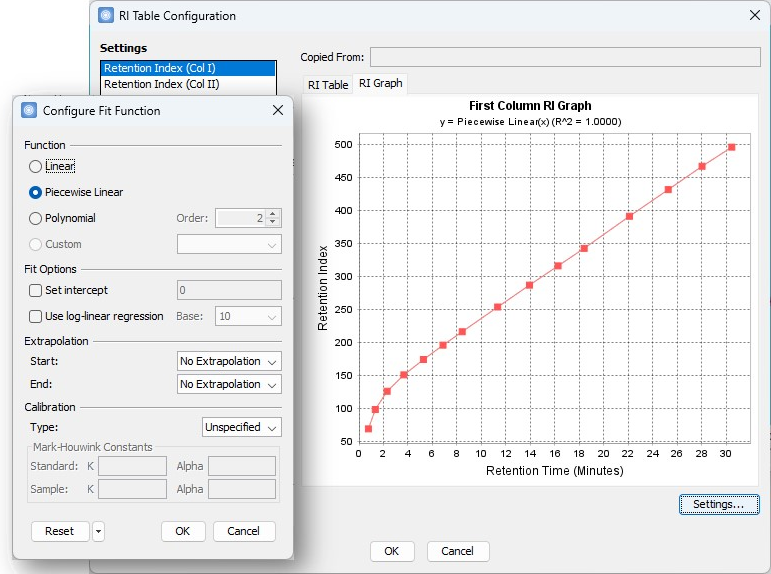
Generic Retention Index Calibration
software provides generic functions to perform calibration from retention times to retention indices or other chemical properties. Custom functions can be used in addition to linear, piece-wise linear, and polynomial functions. Also, 2D region-based boiling point calibration is supported for SimDist analyses with GCxGC, and molecular weight calibration is supported for 2DLC (HPLC/GPC).
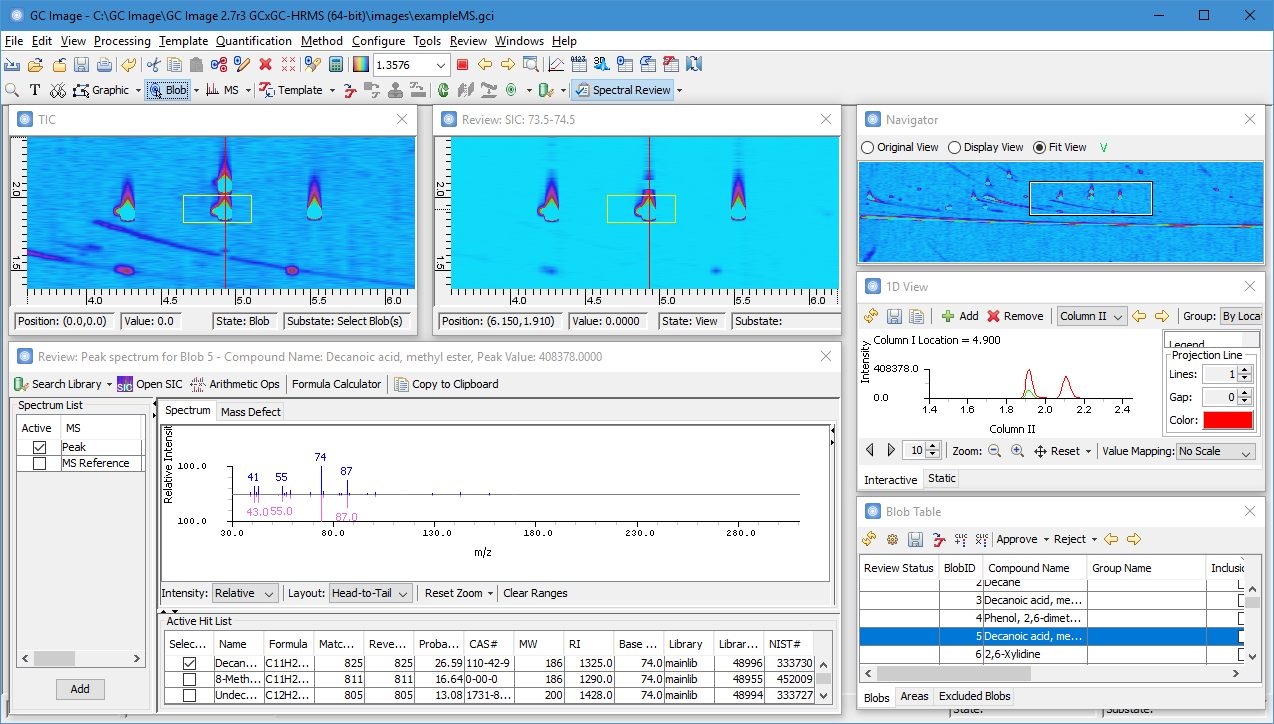
Mass Spectrometry, HRMS & MS/MS
The software supports data from a wide range of multispectral detectors, including MS and DAD/PDA. An array of tools support spectral matching, library search, and selected ions/channels analysis, with options for handling adducts. The software supports high-resolution MS and MS/MS with additional tools for mass calibration and exact-mass, isotope, and mass defect analyses. With HRMS data, the software can perform detailed hydrocarbon type analysis using molecular ions and compound formulas.
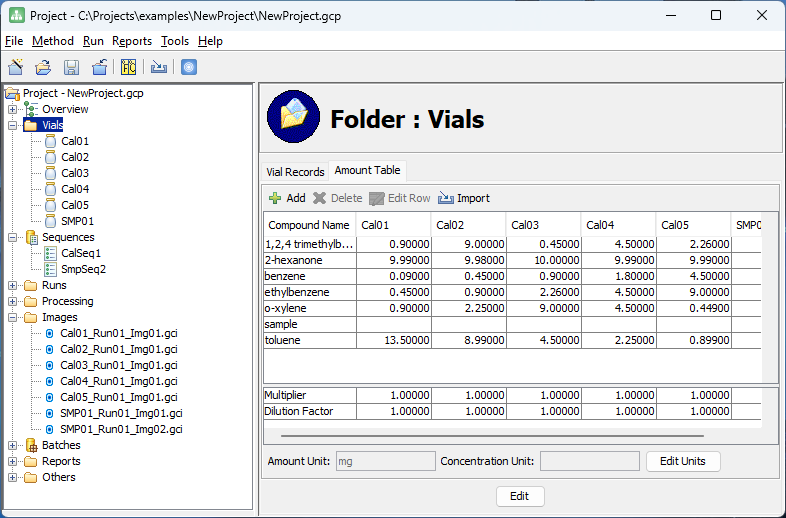
Project Management & Reporting
The Project interface supports managing and batch processing sequences of runs, and generates and exports reports to LIMS and external software such as Excel.
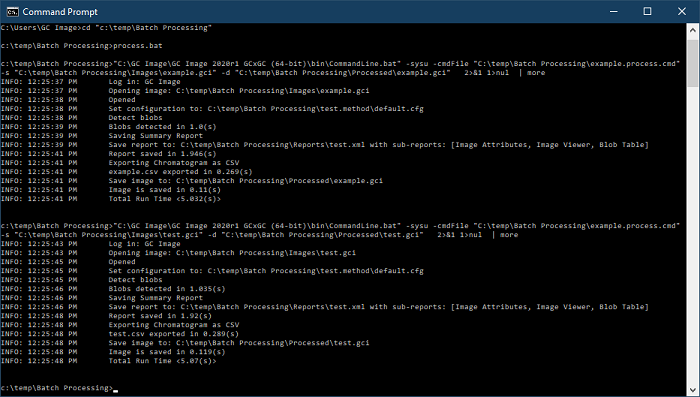
Command Line Interface
The Command Line interface allows processing a single raw data file or re-processing a chromatographic image with a Method or scripting. The interface can be used to create workflows that integrate multiple tools for automating routine analysis or complicated processing.
Support for Agilent 2D-LC
The software supports processing of Agilent 2D-LC data acquired with multiple heart-cutting, high-resolution sampling, or comprehensive 2D-LC mode.
Raw Data Processing & Alignment
The software provides multidimensional, multispectral data processing including 2D baseline correction, peak detection, multivariate peak unmixing, and library search. Also, raw data can be aligned using automated matching, alignment points, or a custom transform.
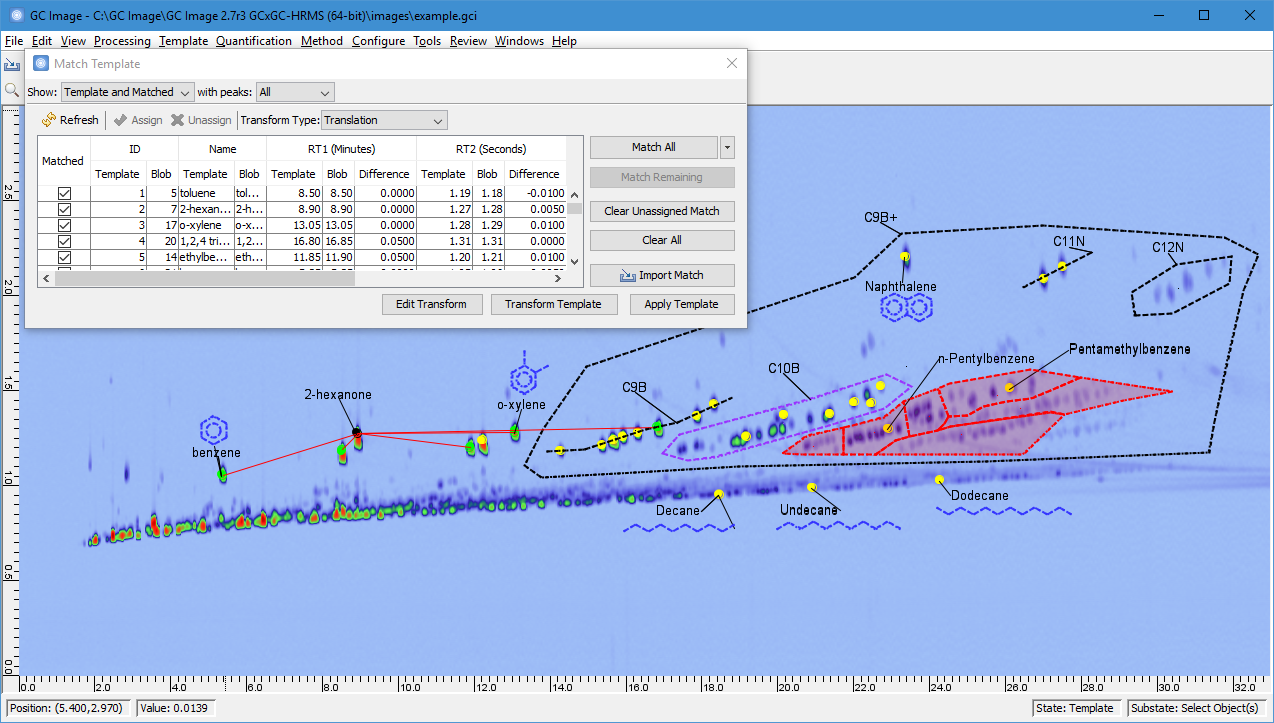
Advanced Peak Alignment, Identification & Analysis
The software allows highly effective chemical identification and analysis with advanced Smart Template™ and CLIC™ technologies to recognize chromatographic patterns and spectral signatures. The automated template matching algorithm performs 2D retention-time alignment assisted by constraints written in CLIC. Simple or complex CLIC expressions can be built using a collection of retention time, multi-spectral, and peak characteristic functions to perform both qualitive and quantitative analysis.
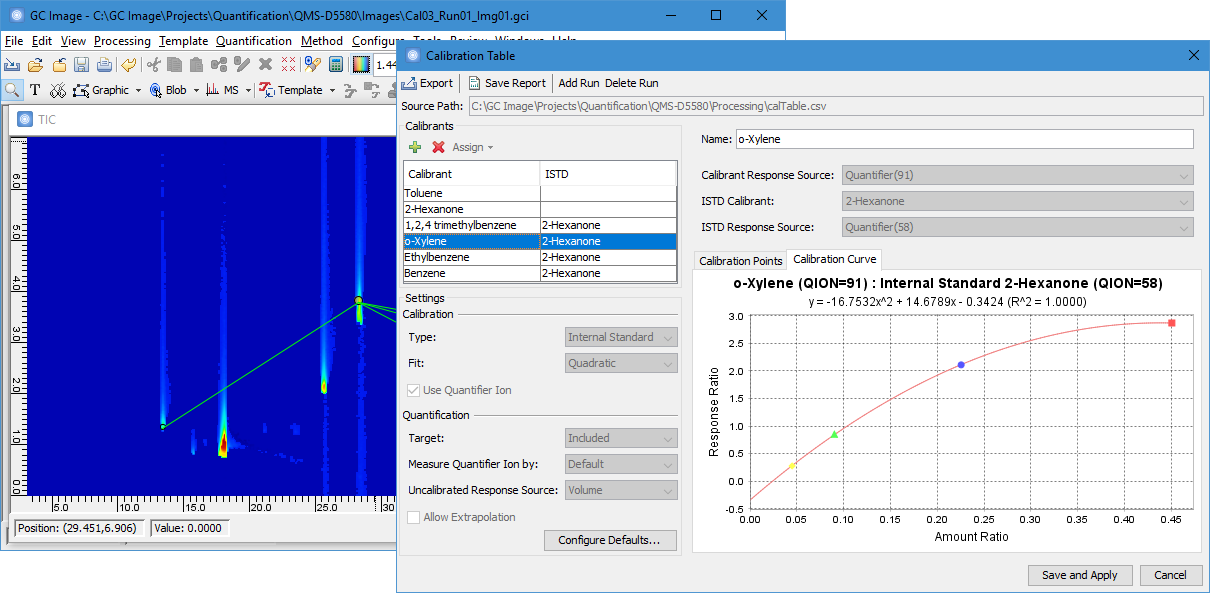
Calibration & Quantification
The software supports external and internal standard calibration and provides tools for creating calibration tables from batches of processed chromatograms quickly and easily. Combined with Smart Template™, the software provides automated quantification and reporting.
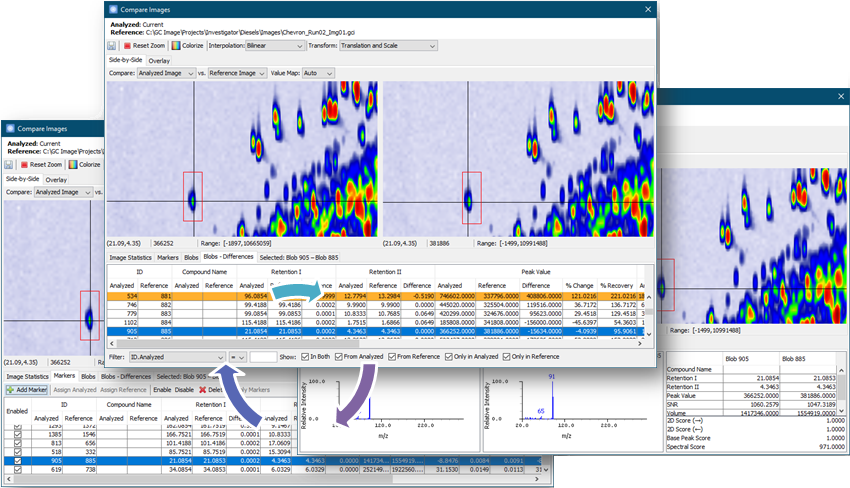
Side-by-Side Comparison
The Side-by-Side Comparison tool enables comprehensive peak matching between two chromatograms and automates difference detection. The tool provides a set of visualizations that allow users to interactively review two chromatograms, the alignment transformation, and peak matches. It provides not only comparative visualization, but also comprehensive characterization of sample differences down to individual peaks.
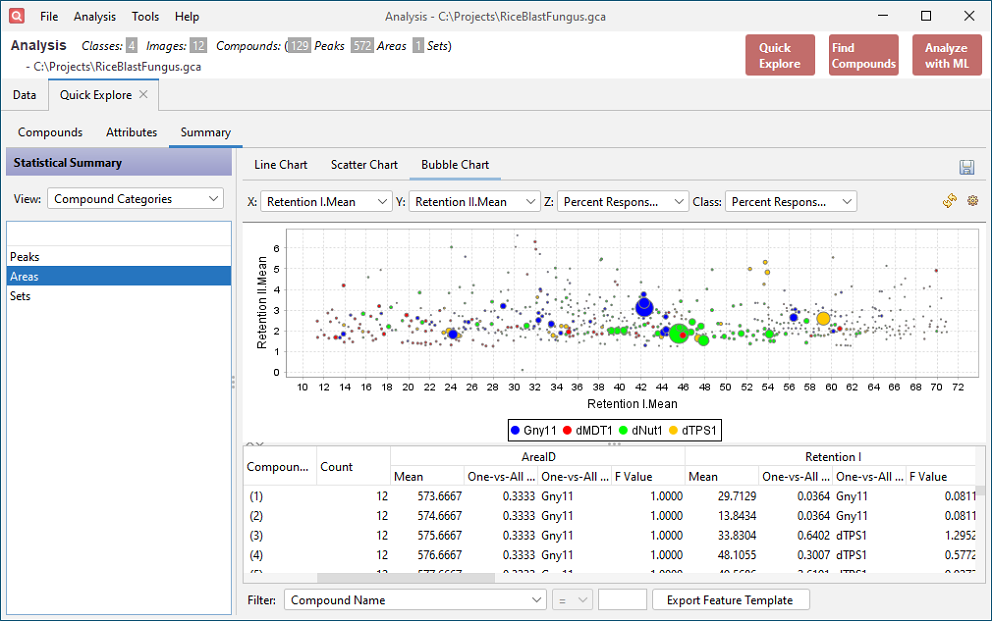
Multi-Sample Analysis
The Investigator tool supports comparing chromatograms, peaks, and peak sets across multiple samples, and examining statistical characteristics and trends with pairwise differences, PCA, Fisher ratios, and F-tests. Customizable charts help identify interesting features, outliers, and class differences.
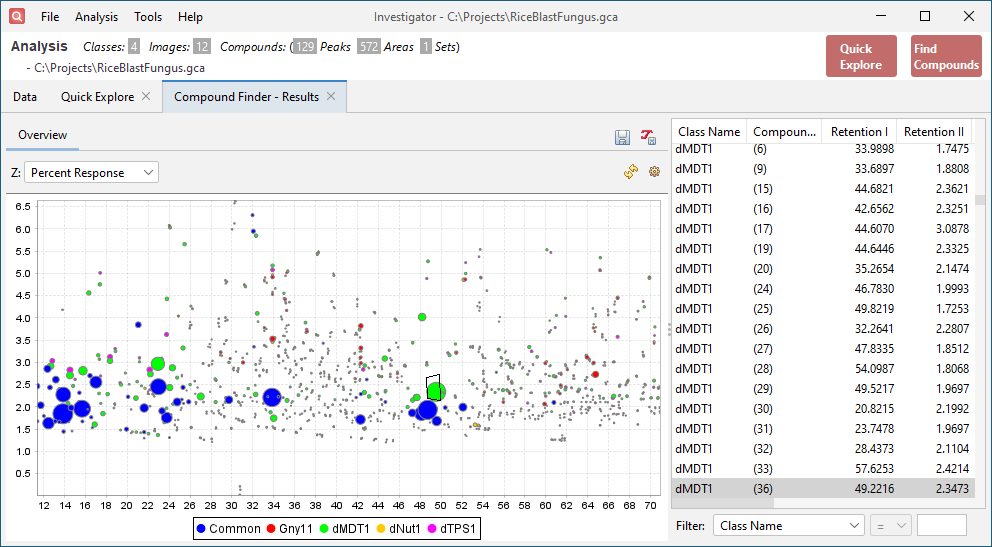
Find Common and Unique Compounds
The Find Compounds tool aids in the discovery of common and unique compounds across multiple samples, and provides quick access to detailed compound information.
Plugins
GC Image software can be fully customized to suit user-specific needs through plugins.