Presentations
Check out the presentations of our latest and past innovations in two-dimensional chromatography data analysis, including new technologies and software solutions that support comprehensive analytics.

Interactive Ion Peak Analysis and Differencing for Comparing Multidimensional Chromatography Data
Comprehensive two-dimensional chromatography coupled with mass spectrometry offers superior separation capabilities for comparing complex mixtures. We extend the Compare Images tool by leveraging spectral information for peak detection and matching ion peaks across chromatograms. This allows for identifying common and unique compounds from pairs of GCxGC-MS and LCxLC-MS chromatograms, as well as performing new peak detection using LC-MS data.

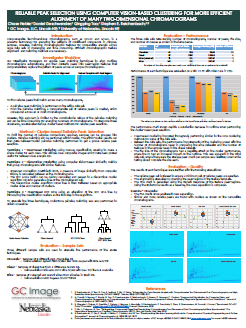
Reliable Peak Selection Using Computer Vision-Based Clustering for More Efficient Alignment of Many Two-Dimensional Chromatograms
Matching chromatographic features across large sets of two-dimensional chromatograms can be time-consuming. We introduce a method that uses computer vision-based clustering to group chromatograms with similar features, reducing the number of necessary pairwise comparisons and improving consistency in peak selection within clusters. This approach significantly enhances the efficiency and accuracy of aligning large numbers of chromatograms for comprehensive comparative analyses. Experimental results with GCxGC data sets demonstrate its practicality and effectiveness.

An Integrated Approach for Alignment using Peak-region and Peak-table Features for GC-MS and GCxGC-MS
A key challenge for non-targeted, cross-sample analyses of gas chromatography/mass spectrometry (GC-MS or GCxGC-MS) data lies in finding the correspondence between compound features across samples. We extended our Investigator framework and demonstrate the effectiveness of our approach on two public GC-MS and GCxGC-MS datasets.

Extended Investigator Workflow and Tools for Directly Aligning Peak Tables of GCxGC-MS Data
GCxGC-MS is increasingly used for cross-sample analyses. The center of analyses is to align peaks across all chromatograms and extract an aggregated peak table, which continues to be one of the most difficult problems. We developed a new workflow that extends the Investigator framework to use peak-region features along with ID and spectra matching to align peaks from the source chromatograms. The new approach ranks and tags all peaks with the peak-region features, which allows easier and quicker verification assisted by search tools.

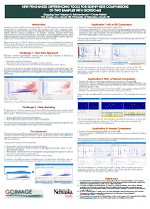
New Peak-Based Differencing Tools for Side-by-Side Comparison of Two Samples with GCxGC-MS
GCxGC-MS produces highly complex data that require both interactive and automated comparative analysis methods. One common task is to compare two chromatograms to determine differences or changes due to chemical components or experimental conditions. A new comparative tool provides a detailed comparison of two chromatograms, utilizing advanced matching techniques and informative visualizations.

New Investigator Tools for Finding Unique and Common Components across Multiple Samples for Comprehensive Two-Dimensional Chromatography
An important data analysis challenge for Comprehensive two-dimensional chromatography (such as GCxGC and LCxLC) is to select a few markers that can be used effectively for clustering and classifying multiple samples. A newly developed workflow and associated tools allow analysts to detect common and unique compounds across many samples with specialized detection and identification constraints that use chromatographic and mass spectral information to distinguish marker compounds.

Interactive Tools for Optimizing Blob Detection and Template Matching for Comprehensive Two-Dimensional Chromatography
Data produced by comprehensive two-dimensional chromatography is rich with information, but extracting and evaluating this information from multiple varying chromatograms can be a complicated challenge. Two new interactive tools provide rapid visual feedback that greatly accelerates the process of determining optimal settings for blob/peak detection and analyte pattern matching.

Advanced Informatics for Peak Detection and Quality Assurance with Comprehensive Two-Dimensional Liquid Chromatography (LCxLC)
The information-rich data generated by Comprehensive two-dimensional liquid chromatography (LCxLC) is large and complex, so automated processing is essential. Therefore, LCxLC data processing operations must be flexible, but configuring automated processing and assuring the quality of results are challenging tasks. New methods and tools for optimizing automated processing and rapid quality assessment (QA) provide multiple visualizations and convenient graphical user interfaces (GUIs) to ensure more reliable data processing.

Rapid Quality Assurance Screening for Comprehensive Two-Dimensional Chromatography
Quality assurance is especially important for complex and sophisticated analyses in challenging applications. A new informatics framework and associated tools are developed to support rapid and effective quality assurance with Comprehensive two-dimensional chromatographic data. The screening interface guides users through a sequence of tightly integrated visualizations that highlight pertinent aspects of the data analysis. During screening, the analyst can confirm acceptable results, make notes, reprocess data, reject unacceptable results, and generate reports.

Data Analysis Workflow for Comprehensive Two-Dimensional Liquid Chromatography (LCxLC)
The End-to-End Data Analysis Workflow (E2E) supports comprehensive comparative chemical analysis with comprehensive two-dimensional liquid chromatography (LCxLC). Comprehensive comparative analysis requires evaluation of every constituent in every sample and is the most general problem of analytical chemistry. E2E utilizes robust peak-region features and encompasses three principal steps: (1) Chromatogram Processing, (2) Feature Extraction, and (3) Comparative Analysis.

Method Development and Automation for Comprehensive Two-Dimensional Liquid Chromatography (LCxLC)

Comparative Evaluation of Peak Detection Methods for Comprehensive Two-Dimensional Chromatography
This research conducted experiments to compare performance of 2D peak detection algorithms. The evaluation results show that watershed algorithm outperforms two-step algorithm for 2D peak detection, in the sense that watershed algorithm is consistently more accurate for 2D peak detection with various levels of noise, peak widths, and retention-time shifts.

Chemical Group Analysis using Smart Templates with Comprehensive Two-Dimensional Gas Chromatography with Mass Spectrometry (GCxGC-MS)
This poster describes initial results for group-type analysis by carbon number of diesel samples using GCxGC-MS and Smart Templates. Smart Templates describe the 2D retention-time pattern of expected peaks and utilize rules pertaining to the retention-times and mass spectra in order to match analyte peaks. Along with CLIC rules for group-type identification, they can distinguish group membership for peaks even where groups overlap in the retention-time plane.

Multi-type Smart Templates with Peak Sets, Areas, and Meshes for Comprehensive Two-Dimensional Gas Chromatography (GCxGC)
Multi-type templates with peak sets, areas, and mesh objects are flexible and effective structures for GCxGC data analysis. Example analyses of petroleum samples demonstrate that the flexibility of multi-type templates is the basis for more effective and robust comprehensive analysis and automation of routine methods.

3D Visualization for SIMS Analysis
Advanced informatics are required to support interactive spatio-spectral analysis of three-dimensional chemical images generated by secondary ion mass spectrometry (SIMS). A new data visualization suite designed to provide an efficient, intuitive and powerful resource for the SIMS analyst working with three-dimensional (3D) data.

Retention-Time Based Peak Clustering in Comprehensive Two-Dimensional Gas Chromatography
Template matching can be used for registering GCxGC data sets in order to identify chemicals in a sample or to identify differences between samples. Manually constructing peak templates can be tedious and time-consuming. This poster describes a method that automates construction of peak templates consisting of representative ‘marker’ peaks based on the inherent relationship between chemical structure and peak position on the retention time plane.

Chemical Group Visualization and Analysis with GCxGC
GCxGC provides increased separation capacity and multi-dimensional structure-retention relationships. This poster presents three software methods for extracting and visualizing chemical groups including clustering, mass-spectral colorization, and group identification with the Computer Language for Identifying Chemicals (CLIC).