Enhanced Boiling Range Distribution Analysis with Slice Reports
What's New in 2024
Version 2024 includes a comprehensive set of enhancements to the Slice Report functionality, specifically designed to enhance the analysis of boiling range distributions:
-
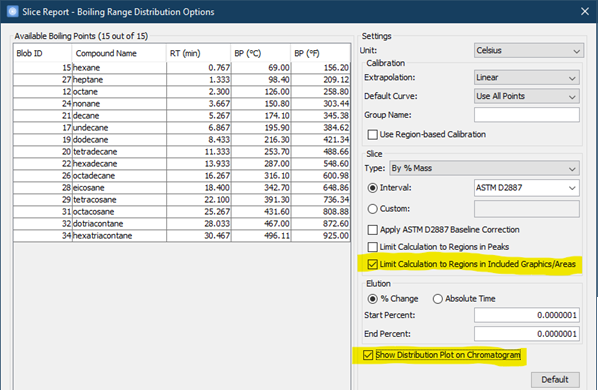
Enhanced Accuracy with 2D Separation: New options allow restricting calculations to detected peaks or custom graphics and areas. This feature leverages the 2D separation power of GCxGC to remove background noise and interferences, leading to more precise results.
-
Tailored Baseline Correction: Leveraging the power of pre-existing data processing, the software supports utilizing data that has already undergone background subtraction and baseline correction for the analysis, ensuring a streamlined workflow.
-
Reduced Setup Time: Generate Slice Reports directly from open images, eliminating the need for time-consuming project setups.
-
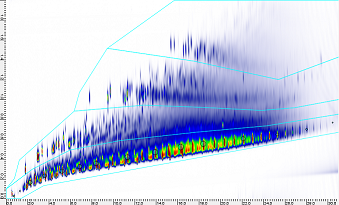
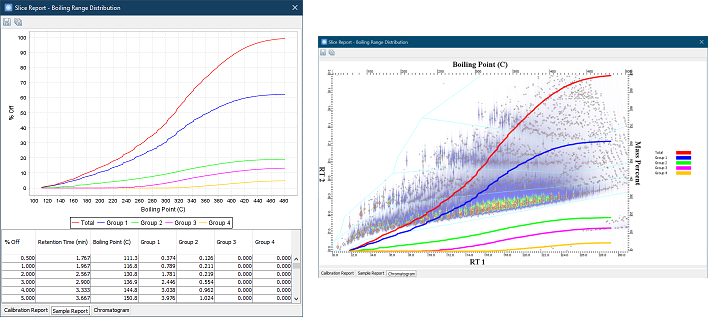
Comprehensive Distribution Visualization: New option to overlay the distribution plot onto the chromatogram image.
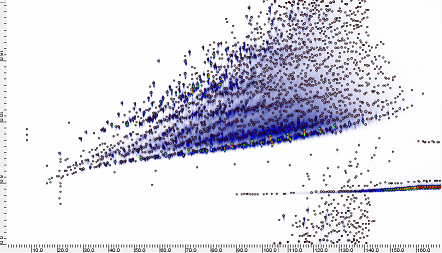
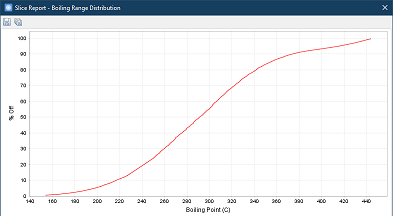
Example 1: Quick Analysis - Generate Slice Reports Directly from Images 
-
Open a processed chromatographic image with included graphics that cover the sample regions and groups.
-
Tools > Slice Report for Boiling Range Distribution
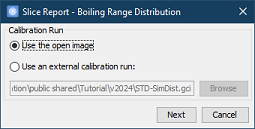
- Choose a calibration run
- Or, even quicker, use compounds already identified in the open image
Note: Compound names and their corresponding boiling points must be available in Compound Library. -
Settings > Slice > choose Limit Calculation to Regions in Included Graphics/Areas and Show Distribution Plot on Chromatogram
-
OK to view the reports
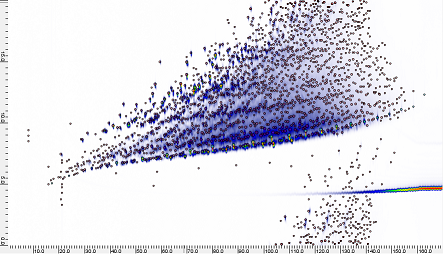
Example 2: Eliminate Interference - Get Better Results with Precise Column Bleed Removal 
-
Open a processed chromatographic image with significant presence of column bleeds.
-
Tools > Slice Report for Boiling Range Distribution to generate the reports (see Example 1 )
Notice that:
- Column bleeds affect the distribution curve at the end.
- Column bleeds are in the middle of the sample matrix, which would be difficult to exclude even with polygonal graphics.
-
Delete column bleed peaks, which could be done either manually or with a CLIC expression using the spectral characteristics of the bleeds
-
Tools > Slice Report for Boiling Range Distribution > Settings > Slice > choose Limit Calculation to Regions in Peaks > OK to re-generate the reports
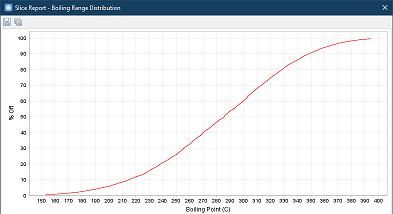
Note that the distribution curve has been corrected.