Quantification Using Group-Based Response Factors
What's New in 2024R1
Version 2024R1 introduces a suite of new features for quantification workflows with group-based response factors, and provides an improved solution for:
-
Routine Group-Type Analysis (e.g. ASTM D8396, UOP-990)
-
Limited Standard Availability: Overcome the obstacle of limited calibration standards in a wide range of samples by utilizing the response factors of related compounds within defined groups for accurate quantification.
Ready to try? Follow the main steps below.
Step 1: Create Calibration Tables from Existing Response Factors
-
Prepare a CSV or Excel response factor table with three columns, Name, RF, Group Name, as shown below:

-
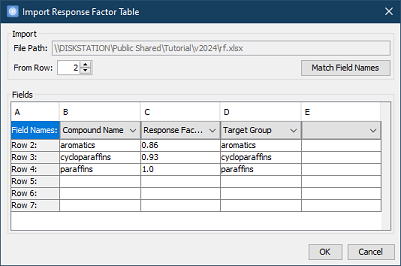
Quantification > New Calibration from Response Factor Table > select the table file and assign columns, as shown below:
-
Then, save it to a
.gccmcalibration table file.
Step 2: Configure Quantification
-
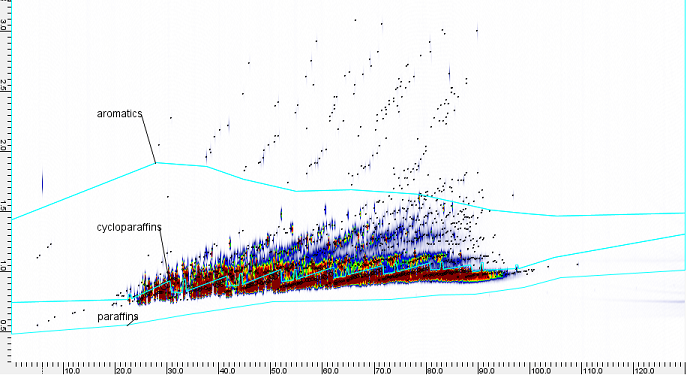
Open a processed chromatographic image with included graphics of targeted groups.
-
Quantification > Load Calibration, and choose the saved
.gccmfile. -
Configure > Blob Table > add
AmountandAmount Percent> open Blob Table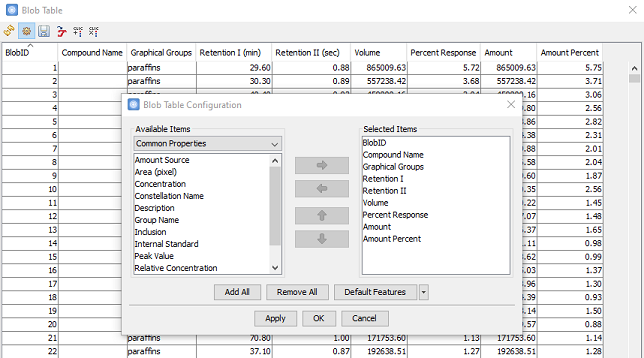
-
Configure > Blob Set Table > add
AmountandAmount Percent> open Blob Set Table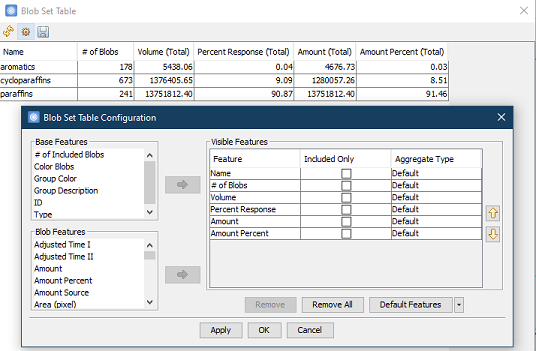
Specify Default Response Factor
If there are some blobs not in any group, but they still need to be counted in total, the Default Response Factor may be specified in the calibration table, as shown below:
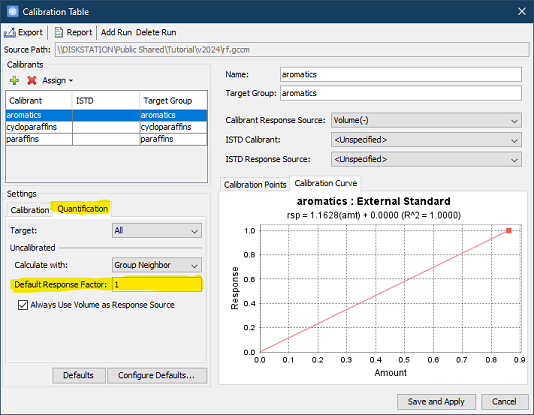
, which will result in a Blob Set Table like below:

Learn More Discover All Release Higlights