GC IMAGE - GC Image LCxLC Edition - User Guide 2025R1
New Features and Improvements in Version 2.9
GC Image LCxLC Edition 2.9 has many new features and improvements. See
the GC Image LCxLC Edition User Guide for full
documentation.
What's New in Version 2.9 Release 3 (March 2020)
Version 2.9R3 has new improvements for 2D-LC data, including:
- The File > Import Agilent 2D-LC
action now supports importing CDF data files with Agilent 2D-LC
metadata, which provides support for customized coupling Agilent
2D-LC with third-party MS instruments.
- The File > Import Agilent 2D-LC
action now supports importing data up to the user-specified run time.
- The Files of Type selection for the File > Import Agilent 2D-LC
now defaults to list all supported Agilent data files (*.ch, *.ms,
*.uv, *.d). Also, the recently used Files of Type selection is now
remembered.
Version 2.9R3 has new I/O improvements, including:
- The file chooser for File >
Import now remembers the most recently used Files of Type
selection.
- The file chooser for File >
Import now includes vendor-specific file format categories, All
Agilent Data Files and All Shimadzu Data Files, in the Files
of Type selection.
- The software now displays and logs more detailed error messages
for troubleshooting if a VUV .db file fails to be imported.
- The software now displays "wavelength" as the spectral axis label
for VUV spectra imported from a VUV .db file.
Version 2.9R3 has new tools and improvements for splitting blobs, including:
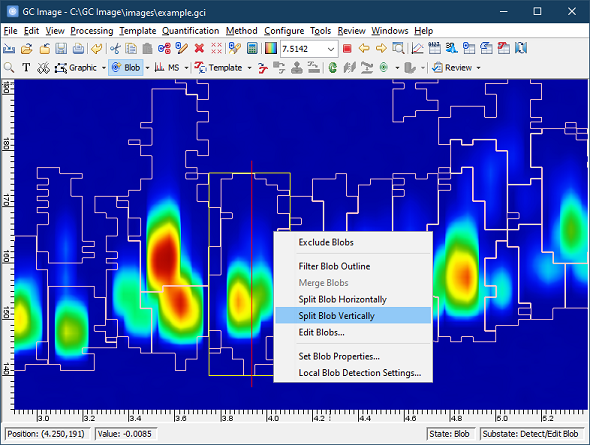
- The Detect/Edit
Blobs cursor mode now supports performing a horizontal or
vertical split on a blob through the right-click menu. Un-excluded
blobs that are not wrap-around can be split by selecting the menu
option. Use left-click drag to set a split location and double-click
the left mouse button to apply the split.
- The Split Blob
operation now shrinks the new blob bounds to fit tightly around both
halves of the split blob.
- The Filter
Blob Outline action from the Detect/Edit Blobs
mode can now edit the boundary with a 0 threshold value, which allows
the unexpected large blob bounds to be manually shrunk without
altering the blob area.
- The Filter
Blob Outline action from the Detect/Edit Blobs
mode now displays a more accurate error message when given an invalid
percentage parameter.
 |
Version 2.9R3 has a new a new log-linear regression setting for Retention Index calibration. When
enabled, the option allows fitting the selected function in the
log-space of the output retention index, i.e., ln(RI) = f(x),
which is useful for performing calibration from retention times to
some chemical properties such as molecular weight.
Version 2.9R3 has a new set of configurable Spectral
Constraints for Template
Matching including Match Factor and Reverse Match Factor. They
can be set as global matching constraints for all template peaks
instead of editing Qualifier CLIC for individual template peaks. The
constraints can be configured from Configure > Settings >
Template Matching, and can be enabled individually.
In addition, Version 2.9R3 has other improvements for template
matching and template display, including:
- A new toggle button was added to the Interactive Match
dialog for displaying only the peaks of a template.
- A new Template Peak Display Size setting has been
added to Configure > Settings > Template to control the display
size of template peaks.
- The Load
Template dialog now defaults to Overwrite instead of Append. Once
changed, the setting will be remembered.
Version 2.9R3 has a new Peak Plot view in the Images Perspective of Investigator. The view provides an interactive bubble plot
of the Blob Table or Area Table for the selected image.
In addition, Investigator now saves an existing analysis with
many images much faster than before.
What's New in Version 2.9 Release 2 (November 2019)
Version 2.9R2 has new and improved I/O facilities, including:
- File > Import has a new Extract
MS/MS from Alternating MS and MS/MS Data option for Agilent
MassHunter targeted MS/MS data files. This new option allows
separating MS and MS/MS data acquired with alternating MS and MS/MS
modes to create a properly aligned chromatographic image.
- The new File > Import Agilent
MassHunter IMS Data menu allows importing drift spectra from Agilent
MassHunter IMS data files. This feature is only available
in HRMS Edition software.
Version 2.9R2 has new and improved operations for displaying and
exploring spectra data, including:
- The software now recognizes common spectral types (including
mass, UV, and drift spectrum) automatically based on the source data
file, and displays the corresponding spectral axis label (i.e. m/z,
wavelength, and drift time). The supported source data file formats
include Agilent ChemStation, MassHunter, and Shimadzu LCD. Also, a
user can configure the axis label by setting the MS Axis Label
custom attribute in View >
Image Attributes > Miscellaneous.
- The new View >
BPC View menu allows viewing the base peak chromatogram.
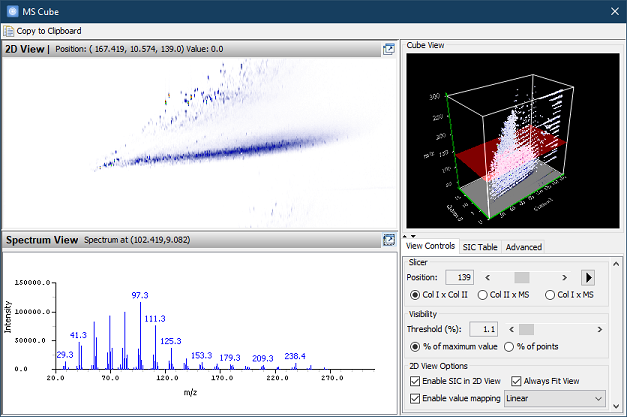
- View > MS Cube UI has a new
layout and default 2D View display settings for browsing and
exploring SICs.
 |
In addition, View >
SIC View has a new option that allows generating selected ion
chromatograms with adducts. A user can select adducts from a list of
common observed adducts in positive and negative ion modes. In
addition, the new option is available in MS Viewer that allows adding
and overlaying mass ranges computed based on adduct selection to a
spectrum for visual inspection.
Version 2.9R2 extends the previous Detect Blob cursor mode to be Detect and Edit Blob mode
with new blob editing tools, including:
- The cursor mode now supports merging the selected blobs
through the right-click menu.
- The cursor mode now supports editing the boundary of a blob
using the peak height based threshold. The
Interactive Blob Outline Filter UI can be invoked through the
right-click menu item Filter Blob Outline. It allows
adjusting the threshold and examining the result interactively.
- Edit
Blobs UI can now be invoked directly from the right-click menu. When
invoked, the UI is set to focus on the currently selected blob.
- Exclude Blobs is now enabled for multiple blobs. Left
mouse click while holding Ctrl key can be used to select
multiple blobs in the cursor mode.
In addition, Edit >
Edit Blobs now copies all blob properties from the active blob to
the new blob when merging two blobs.
Version 2.9R2 has other new and improved operations, including:
- New Search Library for Blobs and Search Library
for Areas commands can now be added to a Method.
- Investigator now
uses less memory on average for large analysis files with many
samples.
- Investigator now
opens large analysis files faster than before.
What's New in Version 2.9 Release 1 (July 2019)
Version 2.9R1 has a new default filter type, Median-Mean, for
the Default Baseline Correction
algorithm and automated noise estimation. This new filter can handle a
rapid changing baseline along Column I dimension better than the
filter in older versions.
Version 2.9R1 has a new feature,
Recalculate
Signal Noise, that allows users to recalculate noise after
baseline correction. It supports estimating noises from
individual strides and/or specified regions, and allows users to
specify background regions manually if automated noise estimation was
affected by some background artifacts. Also, the new operation
provides three different ways to estimate noise, IID, Standard
Deviation, and Peak-to-Peak, and can be added to a method for batch
processing.
In addition,
- Blob Table now can be
configured to show Peak-to-Peak noise and SNR columns.
- Tools > Visualize Data now computes and displays both
population and sample standard deviations of data point values in the
selected region.
Version 2.9R1 has a new Detect Blob cursor mode for Local Blob Detection. The mode supports
detecting a blob at the location indicated by the mouse double click
or drag selection. If the location is not contained by existing blobs,
the program will detect a blob at the location automatically. If the
location is contained by some existing blob, the program will select
the blob, and invoke Local Blob Detection to allow users to re-detect
blobs within the blob area.
In addition,
- Local Blob Detection now
remembers the recently used settings.
- Blob Table now can be configured to show the
following new pixel-based peak width properties:
- Size I (pixel) and Size II (pixel): Size of column I and
column II bounding box in pixels.
- Size I(50.0) (pixel) and Size II(50) (pixel): Size of
column I and column II bounding box for values 50% of peak in
pixels.
- Size I(w) (pixel) and Size II(w) (pixel): Size of column I
and column II bounding box for values w% of peak in pixels.
, in addition to axis-unit-based properties, which can be used
to filter noisy artifacts detected as blobs.
- Interactive Blob Detection now
presents a list of suggested properties including Retention I,
Retention II, Size II (pixel), Area (pixel),
Peak Value, Volume, and SNR, when adding a new
constraint as a filter. Also, all blob properties are organized into
easy-to-find categories.
GC Image LCxLC Edition 2.9R1 has new improvements for Template > Import Compound
List, including:
- A new option for including all unspecified columns as custom
attributes. When this option is selected, all unspecified columns will
be imported into the Description field of corresponding template peaks
as custom attributes.
- A new import setting, Apply Phase shift that allows applying a shift
to the imported compound peaks. The user can choose to apply the same
phase shift as the image or specify a shift amount. The imported
compound peaks will wrap around the image if required.
- Compounds that are out of the lower retention bounds of the
chromatogram are now highlighted in red. An error message will
be shown if no valid compounds can be imported.
Version 2.9R1 has new improvements for Investigator,
including:
- Investigator now supports filtering entries in Images and
Compounds perspectives, in addition to Summary perspective. In Images Perspective,
images can be filtered by name or class label. Blob Table, Area Table,
and Blob Set Table of an image can be filtered by the selected
column. In Compounds
Perspective, compounds can be filtered by name.
- In Attributes
Perspective, Investigator now runs Principal Component Analysis
(PCA) in the background, which allows users to switch between tabs
and continue working while it is being processed. Only one PCA can be
processed at a time. The process can be canceled using the Cancel PCA
button at any time.
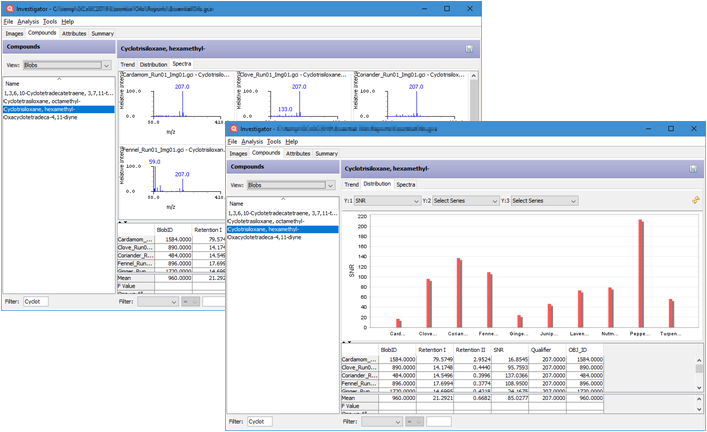
- Investigator now has targeted views in Compounds
perspectives
- Trend: Line charts show trends of the selected
attributes based on the sorting order of the current table.
- Distribution: Bar charts show how values of the
selected attributes are distributed across sample images.
- Spectra: Spectral views show the spectra of the
selected compound across sample images if Spectrum
attribute is available.
 |
Version 2.9R1 has other new and improved operations, including:
- Edit > CLIC Expression now lists all blob
properties in easy-to-find categories next to the Functions
list.
- Configure > RI table now presents a list
of suggested compound properties including Library BP, Library
Molecular Weight, and Library RI, when populating the table.
In addition, the Populate UI organizes all blob properties into
easy-to-find categories.
- All figures and chromatogram images in Reports
are now saved as PNG instead of JPEG to provide the best quality for
presentation. In addition, File > Export Image as
Picture now can save a chromatogram image in a GIF format.
Contents Next:
Introduction
GC Image™ LCxLC Edition User Guide ©
2001–2019 by GC Image, LLC, and the University of Nebraska.


