Plugin: Type Analysis with GCxGC/Soft Ionization Data

Discuss with developer team, share useful tips, report bugs, request new features and anything else
Post Reply
qtao
Posts: 209
Joined: October 7th, 2011, 10:16 am

Plugin: Type Analysis with GCxGC/Soft Ionization Data

Post by qtao »

The Type Analysis plugins assist the analysis of compound groups in a complex mixture data acquired by two-dimensional chromatography coupled with soft ionization MS, such as Type Analysis by GCxGC/FI from JEOL.

Installation
The plugins require Version 2.6 or later.
  1. Download here: Type Analysis plugins
  2. Unzip using File Explorer or another application.
  3. Start GC Image.
  4. From the menu, select Tools > Manage Plugins...
  5. Import both SoftIonMS-TypeAnalysis and TypeAnalysisCLICFunc plugin folders.
Workflow
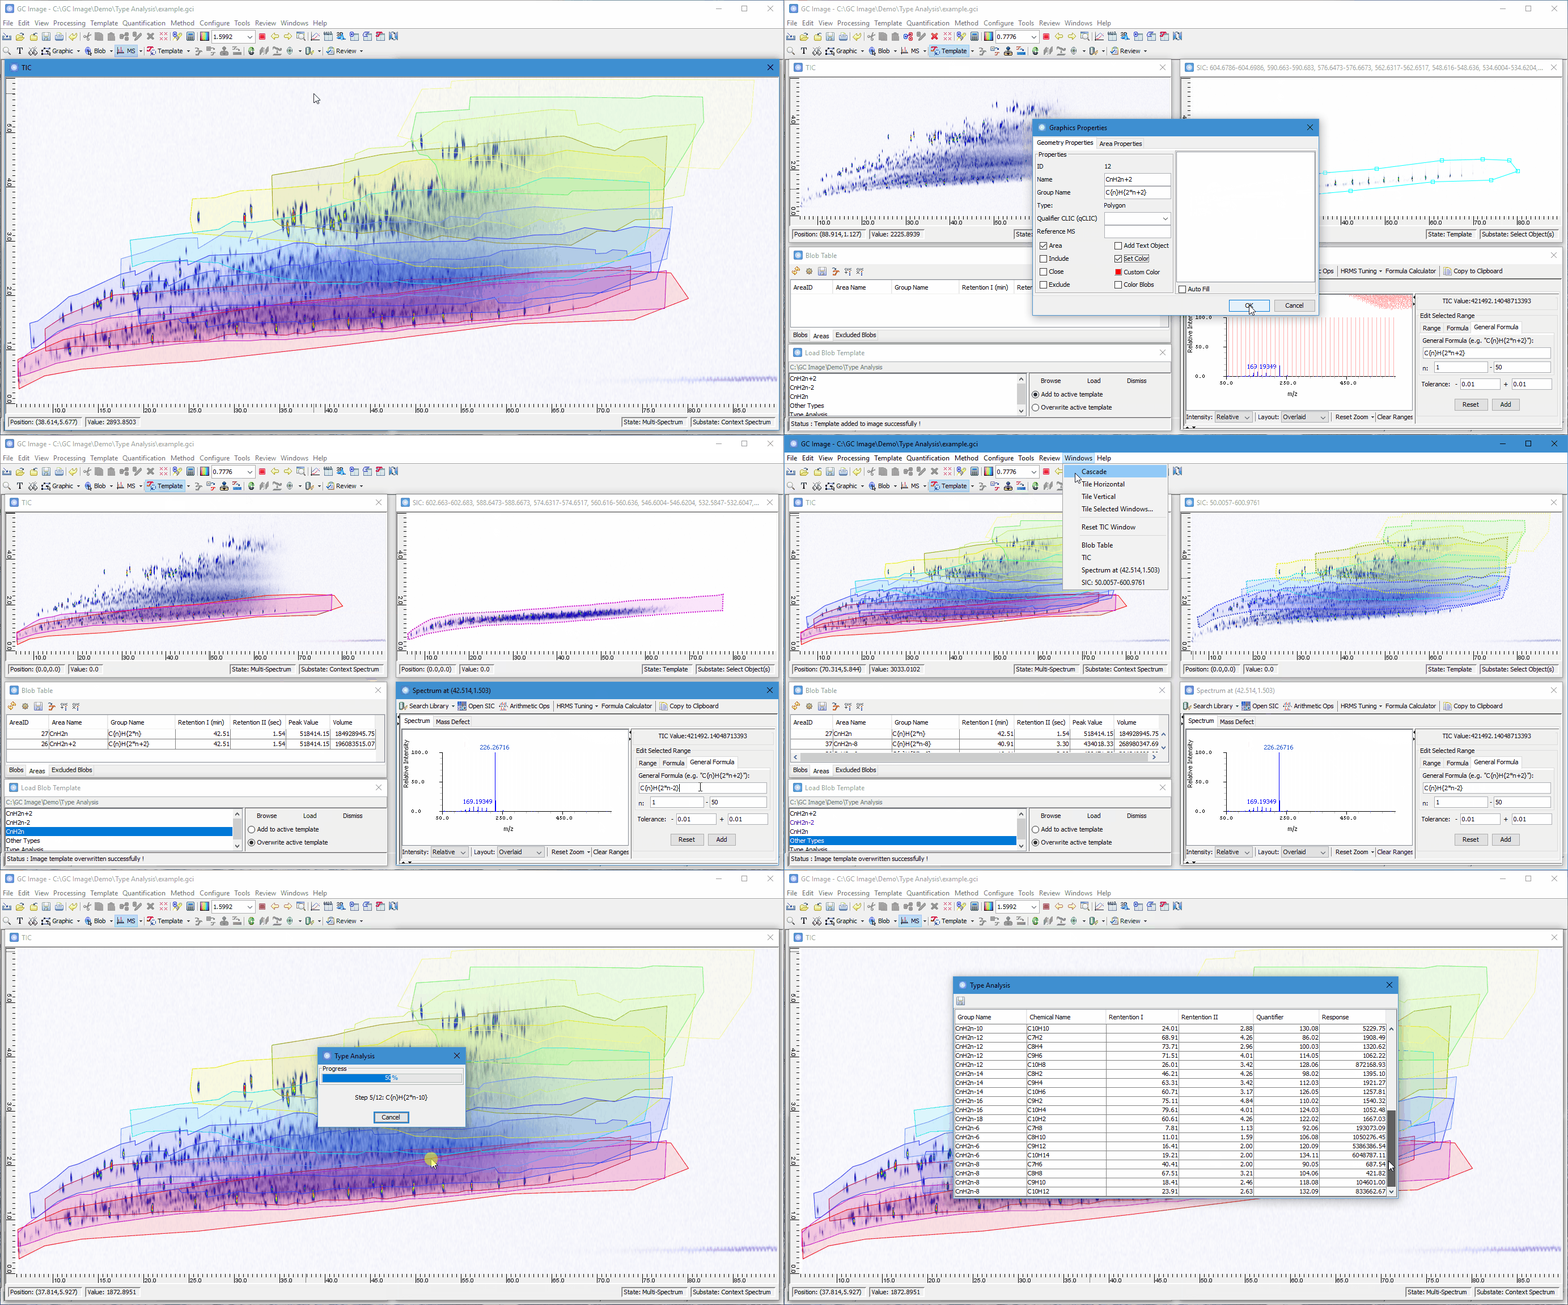
  1. For each group, create a single polygon area from SIC or CLIC.
  2. Specify the general formula in Group Name of the area. Note that the format of a general formula is elements followed by an expression in the curly brackets. For example:

    Code: Select all

    C{n}H{2*n+2}
  3. Tools->Type Analysis, and specify:
    • The range of the parameter
    • The constraint for identifying compounds
    For example, for n = 7 to 28, set the constraint to:

    Code: Select all

    ARelative(ExactMass("<group>"))>=5
    , where <group> will be replaced by a formula generated from the general formula specified in Group Name.
The results are reported as a compound table that lists the targeted formulas along with their apex retention times and total responses from molecular ions.

Constraints for Identifying Compounds
The plugins provide two special CLIC functions to make locating molecular ions easier:
  • FindBasePeak2(from, to) returns the base peak within the specified mass range.
  • FindBasePeak3("<list of masses>", tolerance) returns the base peak of the specified masses within a tolerance window.
Examples:

Code: Select all

(abs(FindBasePeak2(ExactMass("<group>")-1, 1000) - ExactMass("<group>"))<0.01) & Intensity("0-1000")>2000
  • The 1st part tests if the targeted mass exists as the rightmost largest peak.
  • The 2nd part tests if the TIC is below an absolute baseline (i.e. 2000).
Code: Select all

(abs(FindBasePeak3("{group}", 0.01) - ExactMass("<group>"))<0.01) & Intensity("0-1000")>2000
  • The 1st part tests if the targeted mass exists as the largest peak of its homologous group.
  • The 2nd part tests if the TIC is below an absolute baseline (i.e. 2000).
qtao
Posts: 209
Joined: October 7th, 2011, 10:16 am

Re: Plugin: Type Analysis with GCxGC/Soft Ionization Data

Post by qtao »

See how to use the plugin in the following demo screencast:

Image
JosephineLuebeck
Posts: 1
Joined: December 4th, 2017, 7:42 am

Re: Plugin: Type Analysis with GCxGC/Soft Ionization Data

Post by JosephineLuebeck »

Hi,

this plugin has been very helpful so far. My learning curve has been very steep. :)

A few questions:
  • The quantifier as output from the type analysis seems to be always the molecular ion. Can this be manipulated to quantify the base peak ion instead? Perhaps via the CLIC expression, but I am not entirely sure...
  • On the same note, can a qualifier ion somehow be added per compound in a group?
  • Is there a possibility to track the integration windows for each compound group, e.g., each C10H8, C11H10 and C12H12?
  • Can the result table from type analysis be manipulated to show, e.g., the number of peaks or the range of the retention windows, or how is this determined (e.g., retention times)?
Perhaps in these cases it is easier to use graphical objects and then set a quantification/qualifier ions instead ..?

Thanks in advance!

Best wishes,
J
qtao
Posts: 209
Joined: October 7th, 2011, 10:16 am

Re: Plugin: Type Analysis with GCxGC/Soft Ionization Data

Post by qtao »

This plugin only reports the response of molecular ions. The purpose of the plugin is to reduce the complexity of creating polygon groups, but still be able to leverage on retention patterns.

If you create one polygon per group, then you don't need this plugin. You can get the response of base peak in Area Table directly with a CLIC column, for example:

Code: Select all

INTENSITY(MASSRANK(1))
On the same note, can a qualifier ion somehow be added per compound in a group?
Yes, just set quantifier ion to individual blobs.
Is there a possibility to track the integration windows for each compound group, e.g., each C10H8, C11H10 and C12H12?
No, not with this plugin. But, you may add as many polygon as you want.
Can the result table from type analysis be manipulated to show, e.g., the number of peaks or the range of the retention windows, or how is this determined (e.g., retention times)?
Perhaps in these cases it is easier to use graphical objects and then set a quantification/qualifier ions instead ..?
In this case, you want to
  • Use Included graphics (and qCLIC if needed) to define groups of blobs
  • Configure Blob Table to report the ion responses
  • Configure Blob Set Table to report the aggregated values
Post Reply