Search found 203 matches
- May 5th, 2021, 10:55 am
- Forum: Application, Discussion, and Bug Report
- Topic: Kendrick mass defect (KMD) analysis
- Replies: 3
- Views: 3964
Re: Kendrick mass defect (KMD) analysis
For the entire chromatogram, a polygon area can be created first, then the Area spectrum can be open to generate the KMD plot. Also, you may filter noises by limiting the targeted region and the number of ions to be plotted. For example, a polygon can be created based on TIC, and Ordinal Limit is se...
- May 5th, 2021, 9:41 am
- Forum: Application, Discussion, and Bug Report
- Topic: Q Exactive GCxGC data
- Replies: 2
- Views: 2418
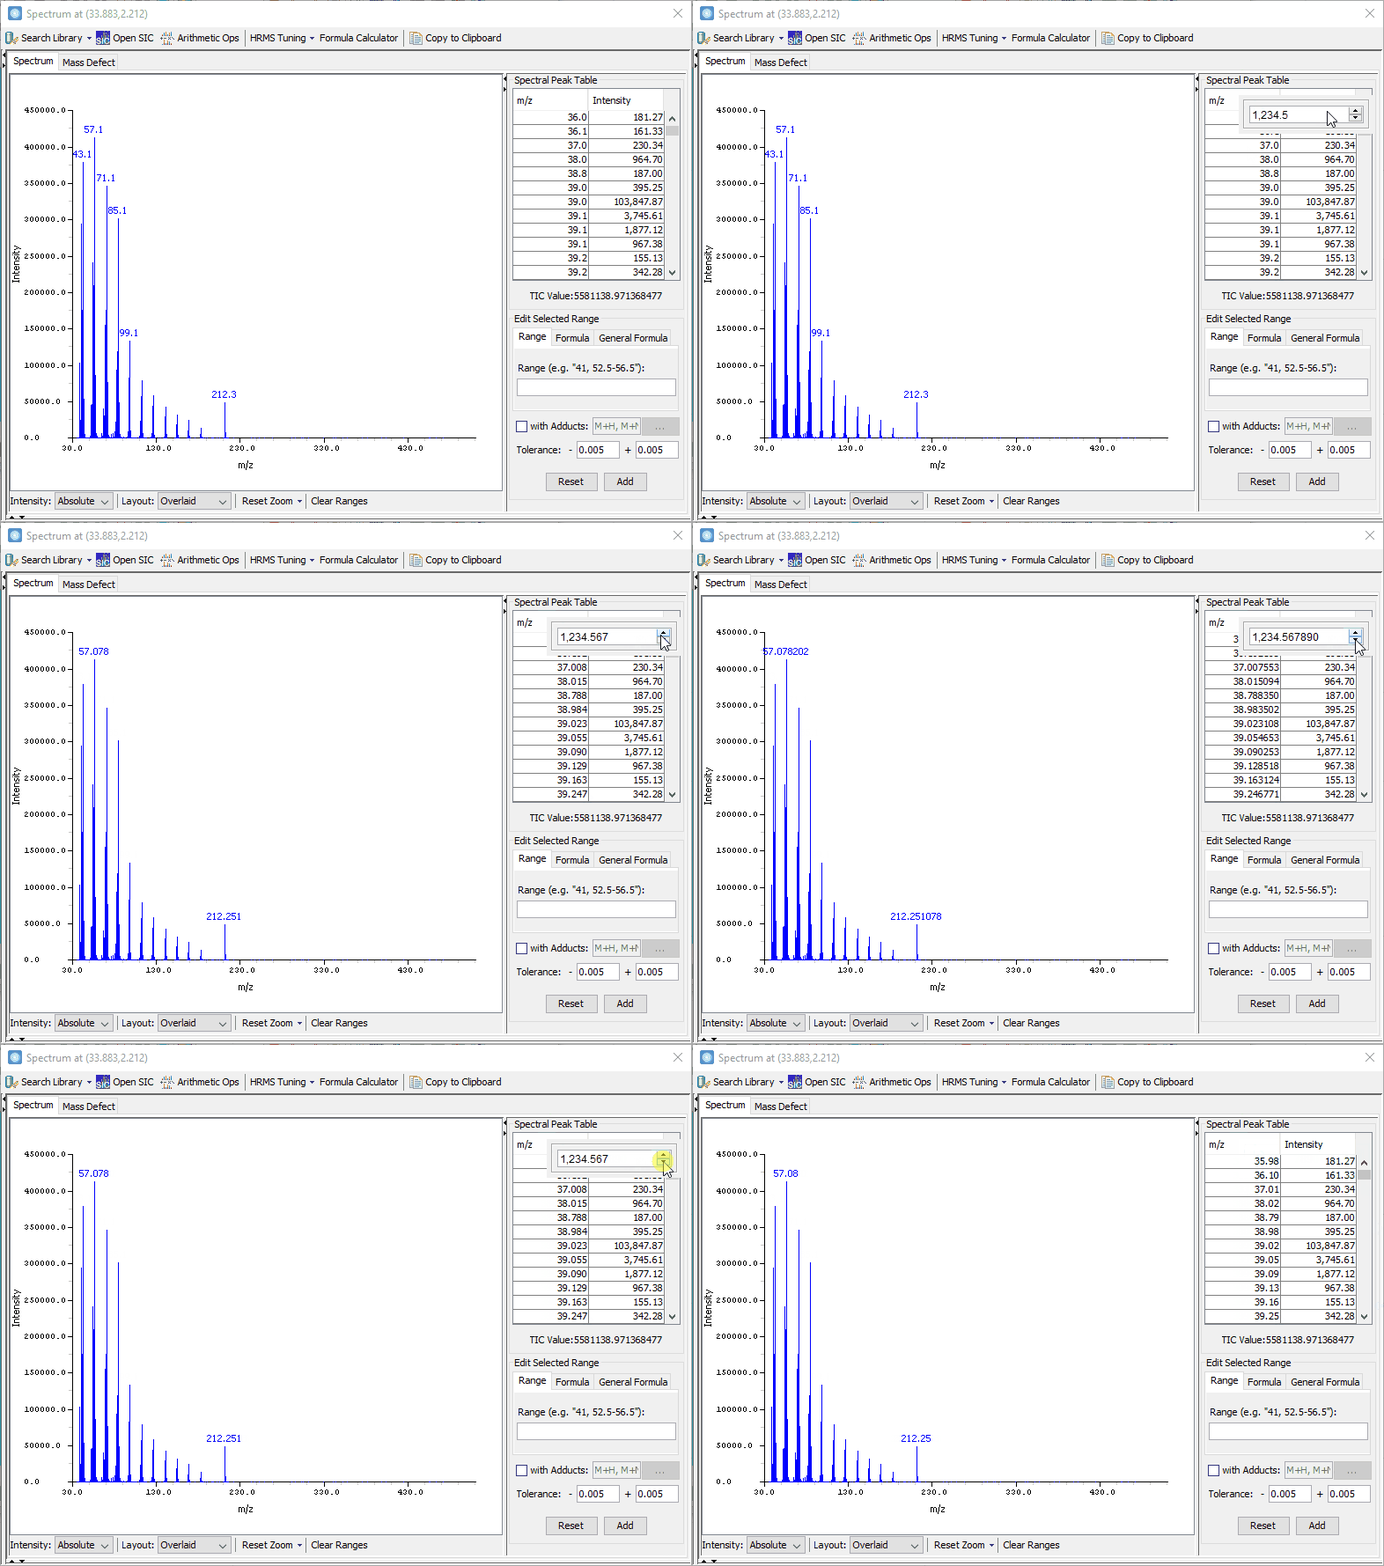
Re: Q Exactive GCxGC data
There is a separate display setting in MS View. To change that setting,
Right click on the m/z column header on the Spectral Peak Table > adjust the decimal places to be displayed
, as shown below:

Right click on the m/z column header on the Spectral Peak Table > adjust the decimal places to be displayed
, as shown below:

- April 27th, 2021, 11:22 am
- Forum: Announcements
- Topic: Investigator ML Software for Pattern Recognition
- Replies: 1
- Views: 8804
Re: Investigator ML Software for Pattern Recognition
We are pleased to announce the release of Investigator ML v2021a1 as a part of the MDC Investigator software. This release includes new features and improvements mentioned above. Please contact us to learn more.
- April 27th, 2021, 11:16 am
- Forum: Application, Discussion, and Bug Report
- Topic: Plugin - Investigator ML
- Replies: 4
- Views: 20999
Re: Plugin - Investigator ML
The latest Version 2021a1 with multi-class support and new classification methods is now available as a part of the MDC Investigator software.
- March 26th, 2021, 4:11 pm
- Forum: How-To Questions & Answers
- Topic: Integrating 1D peaks
- Replies: 1
- Views: 3740
Re: Integrating 1D peaks
It is possible to manually integrate these peaks using local blob detection/editing tools under Detect/Edit Blobs mode, or using area objects. Alternatively, it might be possible to specify the front as no modulation through the Variable Modulation option when importing the data. Then, detection wil...
- January 14th, 2021, 11:46 am
- Forum: How-To Questions & Answers
- Topic: change font in mass spectrum image
- Replies: 1
- Views: 3547
Re: change font in mass spectrum image
The font size cannot be changed. You may copy and paste the spectrum graph to PowerPoint, and then overlay some text boxes to add bigger labels.
- December 31st, 2020, 11:37 am
- Forum: Announcements
- Topic: Maintenance Package 2020R1.2 Now Available
- Replies: 0
- Views: 8391
Maintenance Package 2020R1.2 Now Available
GC Image and LC Image Version 2020R1.2 include critical bug fixes and improvements over previous 2020 releases. Improvements: Tools - Analyze Blobs' Loadings Matrix table now can be sorted and saved Configure - New Remove button for the profile file path in Image Attributes Bug Fixes: I/O - Export P...
- November 25th, 2020, 10:57 am
- Forum: How-To Questions & Answers
- Topic: set quantifier for a set of blobs
- Replies: 1
- Views: 3768
Re: set quantifier for a set of blobs
There is no direct way to set the same quantifier for multiple blobs. A workaround is copy and paste the quantifier in Blob Table one-by-one as below: Configure > Blob Table > add Quantifier (1) View > Blob Table > mouse click on the Quantifier cell of a blob > press Ctrl+V to paste If the blobs are...
- November 16th, 2020, 5:52 pm
- Forum: Announcements
- Topic: Work from Home with GC Image during COVID-19 Pandemic
- Replies: 1
- Views: 11325
Re: Work from Home with GC Image during COVID-19 Pandemic
For users of older versions, the previous work-from-home policy has already ended in June 2020. We recommended you to check out the v2020 trial version and upgrade to the latest version to continue receiving our work-from-home support. To get a free v2020 trial, please visit the trial pages of GC Im...
- October 12th, 2020, 9:28 am
- Forum: Application, Discussion, and Bug Report
- Topic: Slice Report for Simulated Distillation Analysis with GCxGC
- Replies: 2
- Views: 27324
Re: Slice Report for Simulated Distillation Analysis with GCxGC
This is for GCxGC SimDist.